Case 57 | Borrowed Success: The Structural Gap Between High Leverage and Real Net Worth

One-sentence summary:
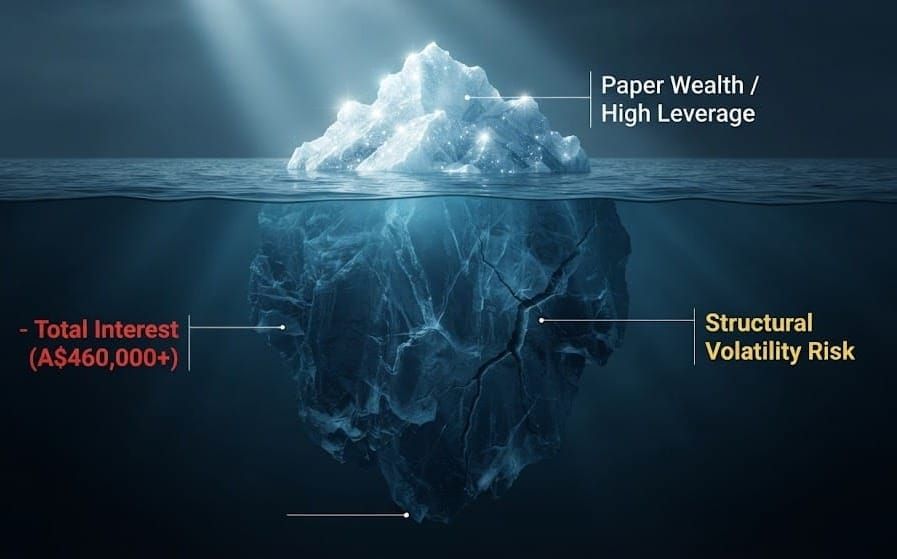
High-leverage purchases of homes and cars are often packaged as "financial intelligence." But once interest costs, cash-flow pressure, and realisable net worth are deducted, the gap between paper wealth and actual net worth is far larger than it appears.
In Cases 50–56, we examined the phenomenon of "narrative capture" across multiple business cases. This week, we turn the lens to a more hidden carrier — the "legal high-interest loan" embedded in personal finance. When high leverage is packaged as financial wisdom, and when paper wealth is mistaken for real net worth, what we need is not emotional criticism, but structural dissection.
1. The Phenomenon: Why Does "Borrowed Success" Look Like Success?
When someone buys a property with a 20% deposit, their balance sheet shows 100% of the property's value as an asset, while their actual capital outlay is only 20%. If the property rises 20% in three years, their paper return appears to be 100% (20% gain ÷ 20% capital).
This number looks impressive, but it rests on the assumption that asset prices will keep rising. The calculation of paper returns usually ignores the interest that must be paid, the cash flow that must be maintained, and the risk if prices fall. In most publicly shared "success stories," these costs are rarely mentioned — yet they are precisely what determine the stability of the structure.
2. The Structure: The Real Cost and Hidden Risks of Leverage
When you borrow to buy a home, you are in effect:
- Renting a sum of money from the bank to acquire an asset
- Using the next 30 years of your income to repay both principal and interest
- Remaining obligated to repay the original debt amount even if market prices decline
Take a A$400,000 loan at 6% interest over 30 years as an example:
- Principal borrowed: A$400,000
- Total repayments over 30 years: approximately A$860,000
- Total interest: approximately A$460,000 (more than the principal itself)
For every dollar borrowed, you repay roughly A$2.15 over 30 years. That A$460,000 difference is the price you pay for the privilege of using the money now. When market conditions shift, the cost of this structure becomes far more visible to the holder.
3. Real Net Worth: The Structural Shrinkage of Paper Wealth
When a person holds a highly leveraged asset, real net worth must subtract the outstanding debt.
Assume:
- Property market value: A$1,000,000
- Outstanding loan: A$800,000
- Paper net worth: A$200,000
If the property price falls 10%:
- Market value: A$900,000
- Outstanding loan: A$800,000 (unchanged)
- Real net worth: A$100,000 (a 50% drop)
Leverage amplifies the impact of price swings on net worth. It is a double-edged sword whose direction depends on the market — and market direction cannot be predicted with certainty.
4. Contrast: The Real Net Worth of a Low-Debt Structure
A low-debt or debt-free structure:
- Carries little or no interest expense
- Does not force sales during market volatility
- Keeps real net worth close to paper net worth
In a falling market, the proportional loss is smaller. In a rising market, the rate of gain may be slower, but the overall volatility is also lower. It is not the structure that "makes the most money." It is the structure that is more likely to remain stable through fluctuations.
5. Closing
"Borrowed success" can indeed magnify paper returns when asset prices are rising. But its structural costs — interest, cash-flow pressure, and volatility risk — are often overlooked. When the system contracts, the paper wealth that once looked like success can shrink faster than expected. Those who maintain structural stability with low debt are more likely to keep operating.
What truly survives across cycles is not the number on the balance sheet, but the structural resilience that does not depend on rising prices to stay upright.
📌 Appendix: This article extends the "narrative capture" thread from Cases 50–56 to the personal finance layer, and aligns with the concepts of "Structural Resilience," "Leverage vs. Real Net Worth," and "Ownership vs. Rental" in the Reality Check toolkit.
Disclaimer: For structural analysis only. Does not constitute investment advice.
Case 57|借來的成功:高槓桿與真實淨值的結構差距
一句話總結:
高槓桿買房買車經常被包裝成「財商」,但扣除利息、現金流壓力和可變現淨值後,帳面財富與真實淨值之間的差距,遠比表面看起來大得多。
在 Case 50-56 中,我們觀察了多個商業案例的「敘事綁架」現象。本週,我們將鏡頭轉向更隱蔽的載體——個人財務中的「合法高利貸」。當高槓桿被包裝成財商,當紙面財富被誤認為淨值,我們需要的,不是情緒批評,而是結構拆解。
一、現象:「借來的成功」為何看起來像成功?
當一個人用20%頭期款買下一套房產時,他的帳面資產是100%的房產價值,但他實際投入的成本是20%的頭期款。如果房產在三年內上漲20%,他的帳面回報率是100%(20%利潤 ÷ 20%本金)。
這個數字看起來很驚人,但這是建立在「資產價格持續上升」的假設上。帳面回報率的計算忽略了需要支付的利息、需要維持的現金流,以及市場價格下跌時的風險。在多數公開的「成功故事」中,這些成本很少被提及,但它們才是決定結構穩定性的關鍵。
二、結構:槓桿的真實成本與隱藏風險
當你借貸買房時,你實際上是在:
- 向銀行「租借」一筆錢來購買資產
- 以未來30年的收入來償還這筆錢及利息
- 如果市場價格下跌,你仍然需要償還與原來相同金額的債務
以40萬澳元貸款、6%利率、30年還款期為例:
- 借入本金:40萬
- 30年總還款:約86萬
- 利息總額:約46萬(超過本金)
每借1元,在30年內需要償還約2.15元。這筆差額——46萬元——是你為「提前使用這筆錢」所支付的費用。當市場環境轉變時,這個結構的成本會對持有者造成更明顯的壓力。
三、真實淨值:帳面財富的結構性縮水
當一個人持有高槓桿資產時,他的真實淨值需要扣除未償還的債務。
假設:
- 房產市值:100萬
- 未償還貸款:80萬
- 帳面淨值:20萬
如果房價下跌10%:
- 房產市值:90萬
- 未償還貸款:80萬(不變)
- 真實淨值:10萬(下跌50%)
槓桿會放大資產價格波動對淨值的影響——這是一把雙刃劍,它的運作方向與市場走向有關,而市場走向是無法預測的。
四、對比:低負債結構的真實淨值
低負債或無負債的結構:
- 沒有利息支出(或支出極低)
- 不需要在市場波動時被迫賣出
- 真實淨值接近帳面淨值
在市場下跌時,這種結構的損失比例較小;在市場上漲時,它的增值速度可能較慢,但整體波動幅度也較小。它不是「賺最多」的結構,但它可能是「在波動中維持穩定」的結構。
五、結語
「借來的成功」在資產價格上升時,確實能放大帳面回報。但它的結構性成本——利息、現金流壓力、波動風險——往往被忽略。當系統收縮時,那些看起來「成功」的帳面財富,可能會比預期更快縮水,而那些以低負債維持結構穩定的人,則有機會維持運作。
真正能穿越週期的,不是帳面財富的數字,而是不依賴市場價格來維持的結構穩定性。
📌 附註: 本文延續 Case 50-56 的「敘事綁架」主線至個人財務層級,對應工具包中的「結構韌性」「槓桿 vs 真實淨值」與「擁有 vs 租借」概念。
免責聲明: 僅供結構分析參考,不構成投資建議。